Understand BAEMIN users' behavior to design a better food exploration journey.
This was one of the most extensive projects I've done at BAEMIN to help revamp the design and user experience when ordering food. The project encapsulates how I combined Research, Data, and Design.
About the project
BAEMIN is a young, fun-looking Food delivery app that has operated in Vietnam for around 4 years.
BAEMIN was competing with other competitors to win market shares, and we were working on different solutions in order to win the users, and try to get away from the unsustainable promo-driven strategy.
As a product design lead, I’ve led a team of UX researchers (qualitative and quantitative) working with the data engineer, product managers, and growth team. We tried to segment our users based on their online ordering behavior, then design a more tailored experience and journey for different needs. We hope this approach will help retain the users and contribute more business impact to the company and product.
The background
New business expansion
BAEMIN aims to position itself as a lifestyle brand for young urban professionals. We designed, curated, and delivered convenient solutions (food, grocery, accessories, cosmetics, etc.) for people's busy lives. The current app focuses only on Food; we want to inform users about our new business and service.
Needs of marketing and sales
Marketing wants to have more activities to engage and retain users.
Sales want to have a better home screen to help promote Partner Merchants
The feedback from Users (NPS/CSAT surveys)
Users are less likely to explore promo collections in a hurry. Also, they feel overwhelmed by similar promo types and are too lazy to explore them.
When users are actively looking for promotion, most collections are applicable for big-value orders (80-100k/order).
The problems with the current design
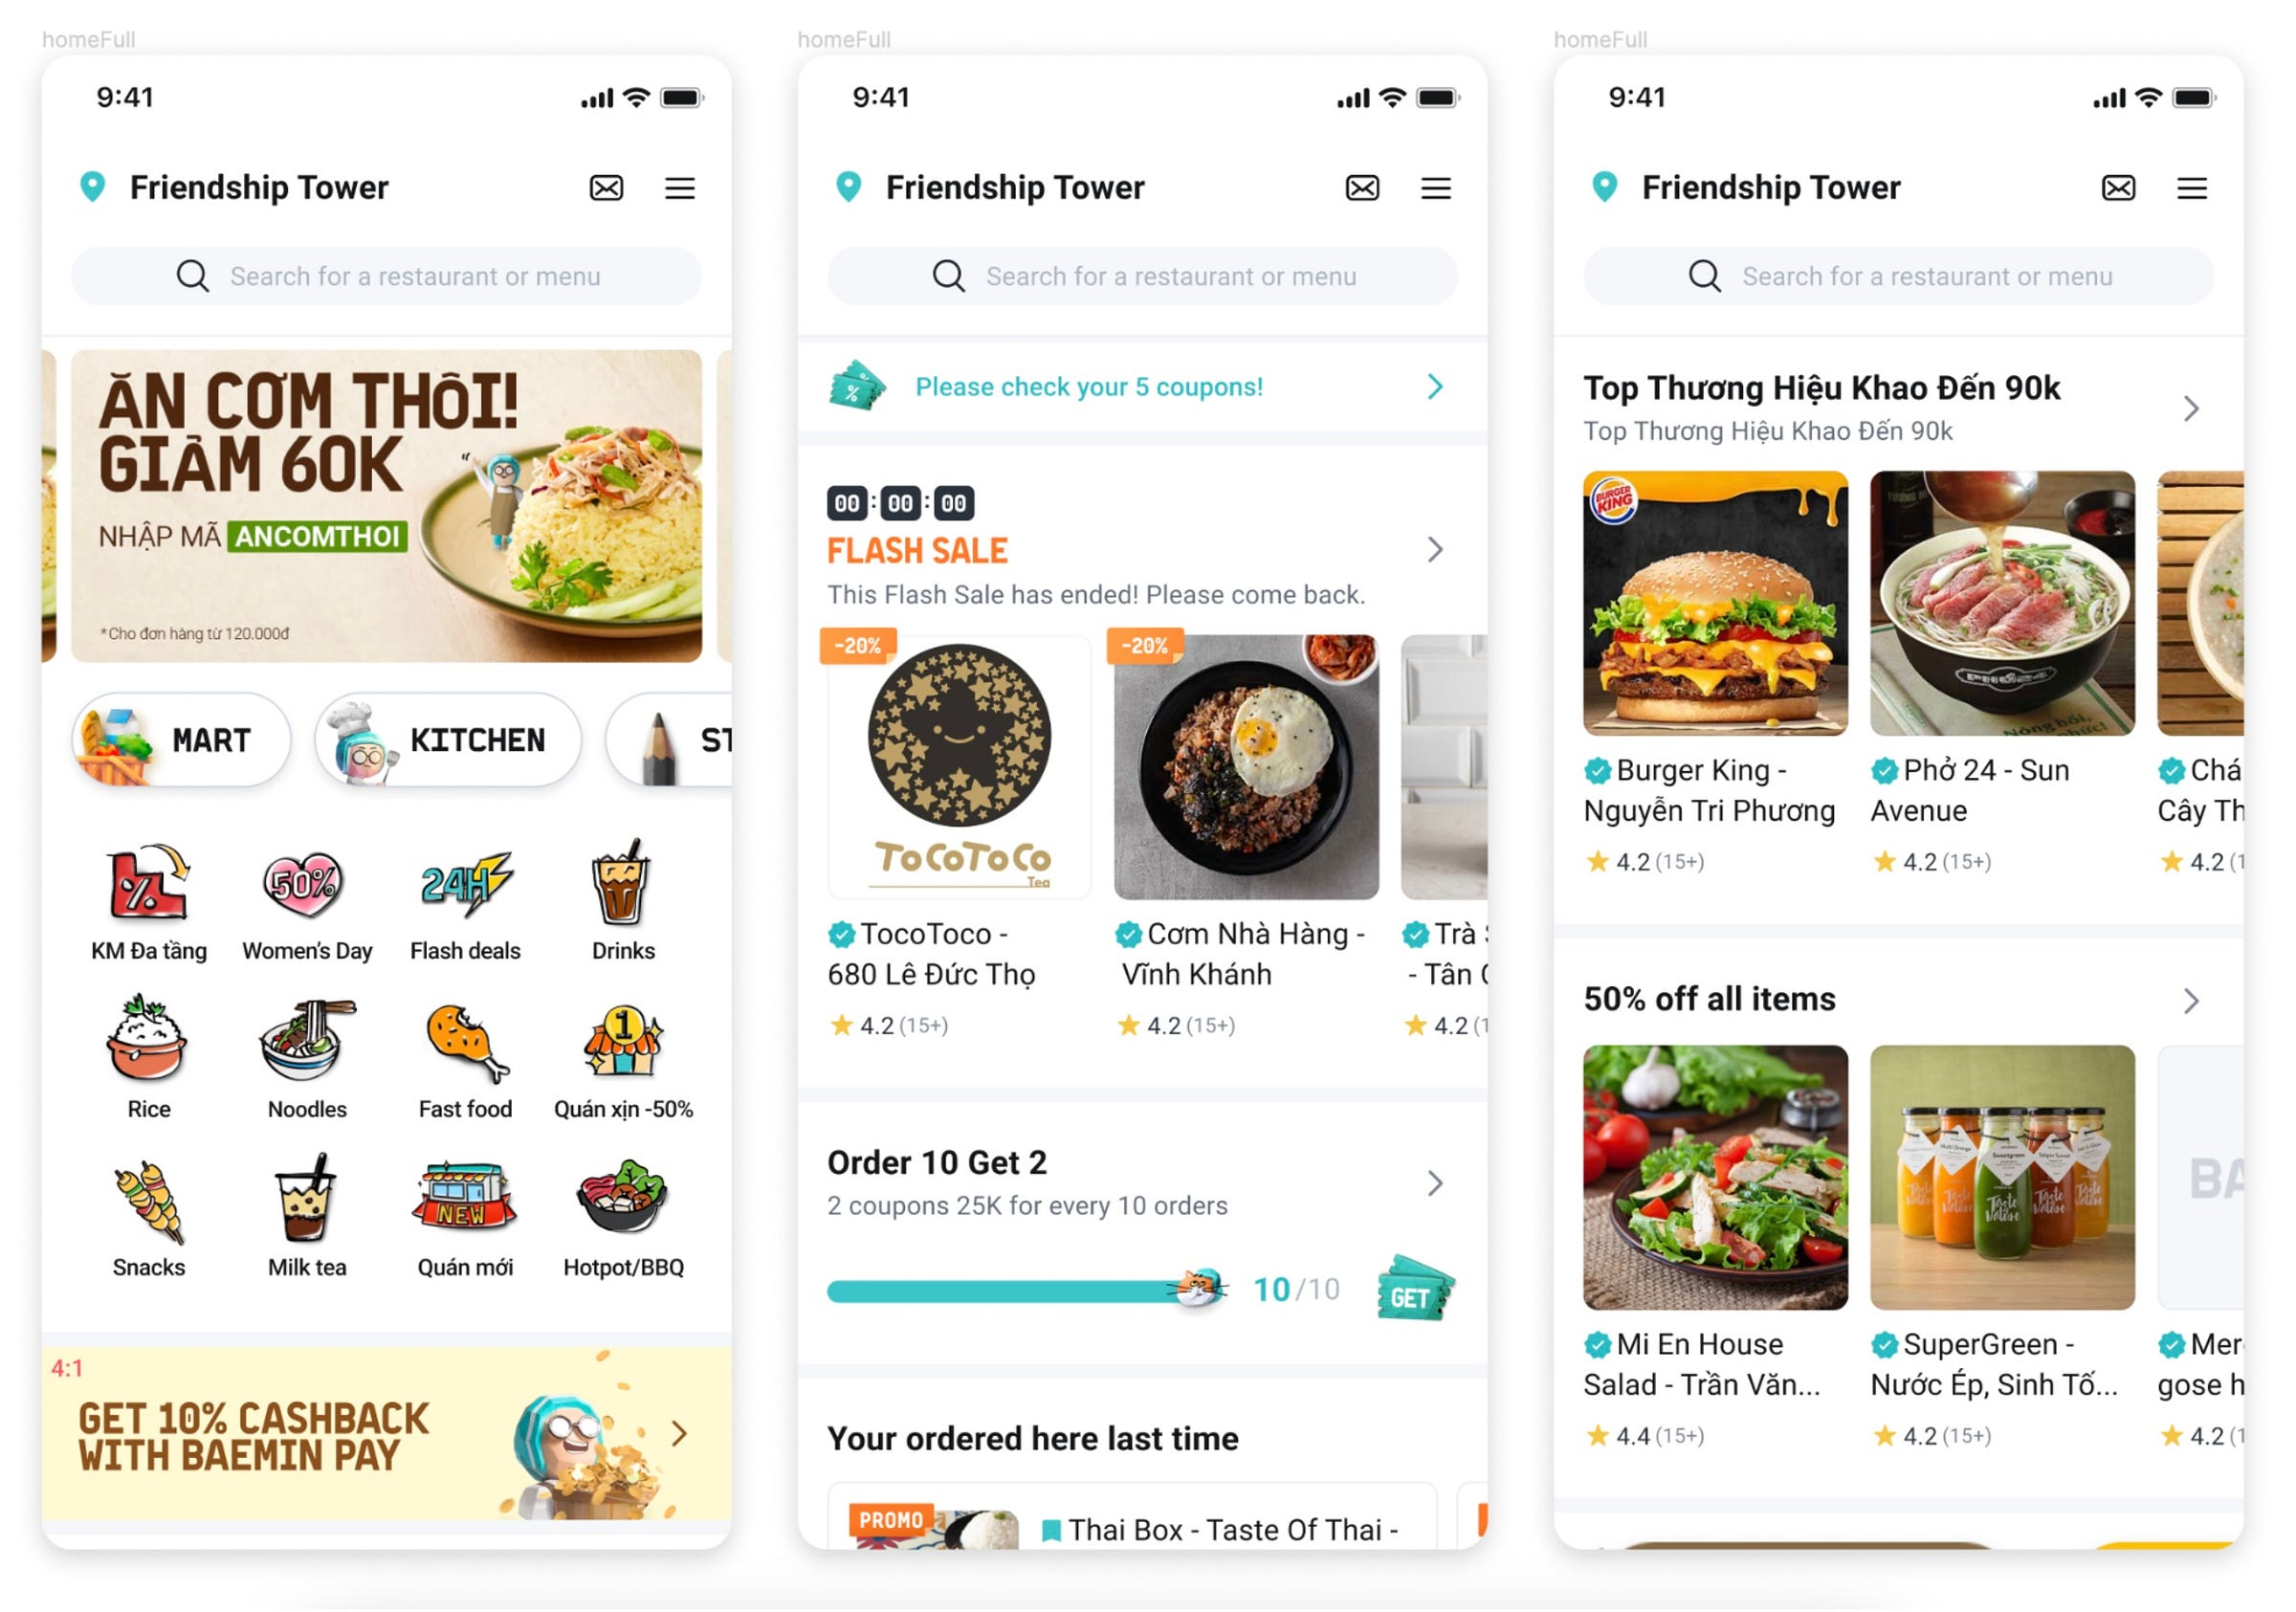
When we reviewed the current design of our BAEMIN food app (at the time of this article), we found that our design was:
Overwhelmed with promotion collections
Creating the expected behavior of promotional focus.
Didn’t highlight other new businesses.
We then had a look at the data and found out:
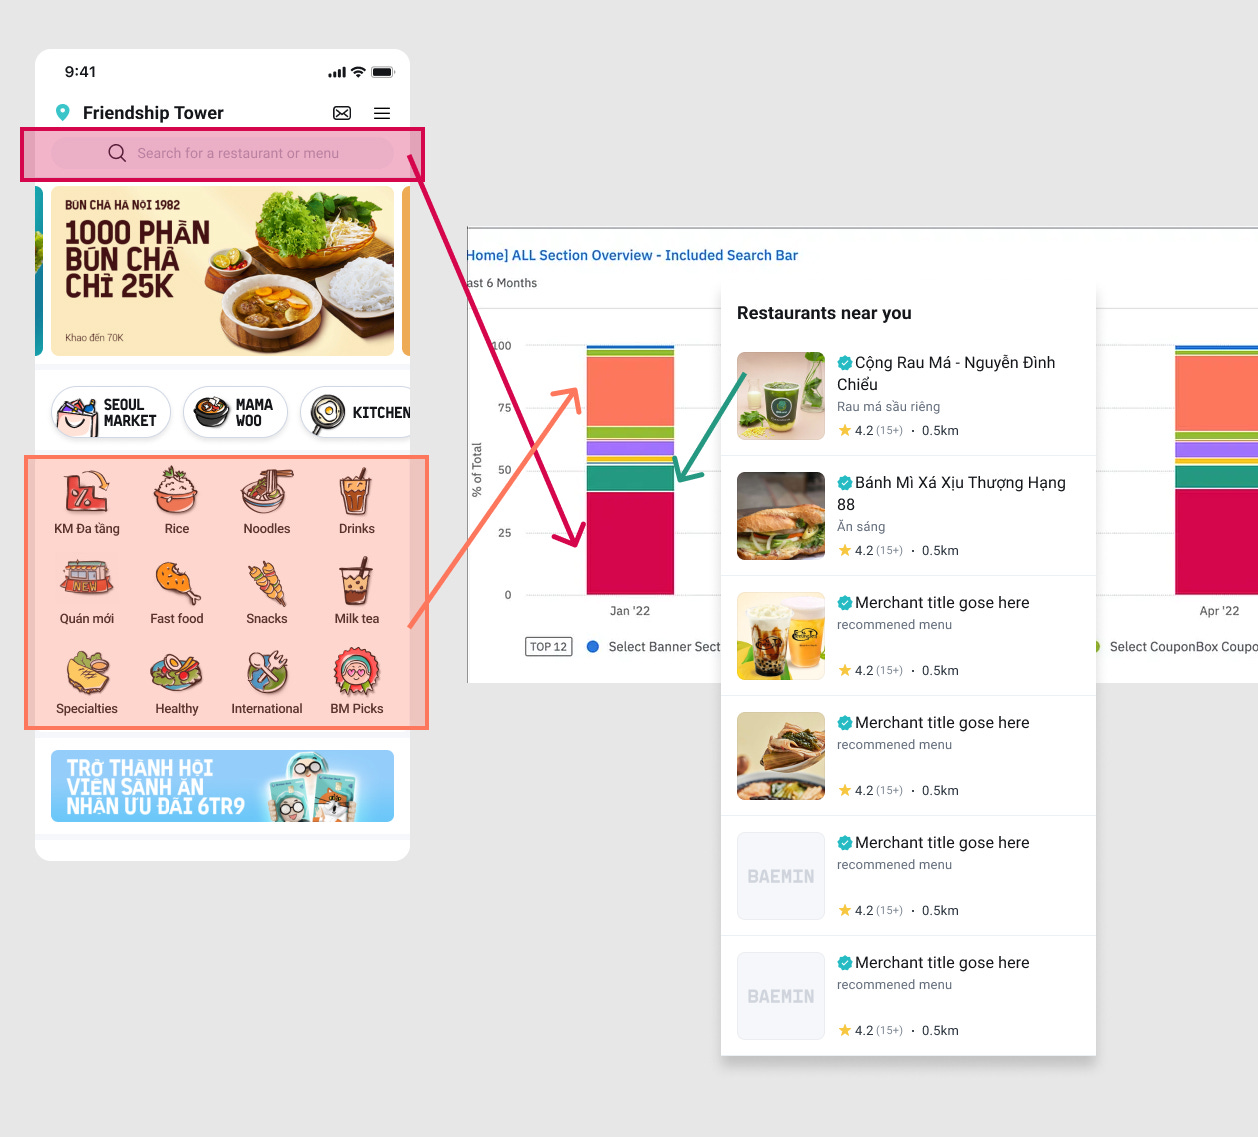
Although we provide multiple promotion collections, users often use the Search or Categories icon or the Nearby Merchants to find food.
This chart explains which sections are the most selected by our users. Users mostly choose the icon section (category icons), the orange color, or the Search bar, the red color. The next most selected section is Nearby Merchants, the green color section.
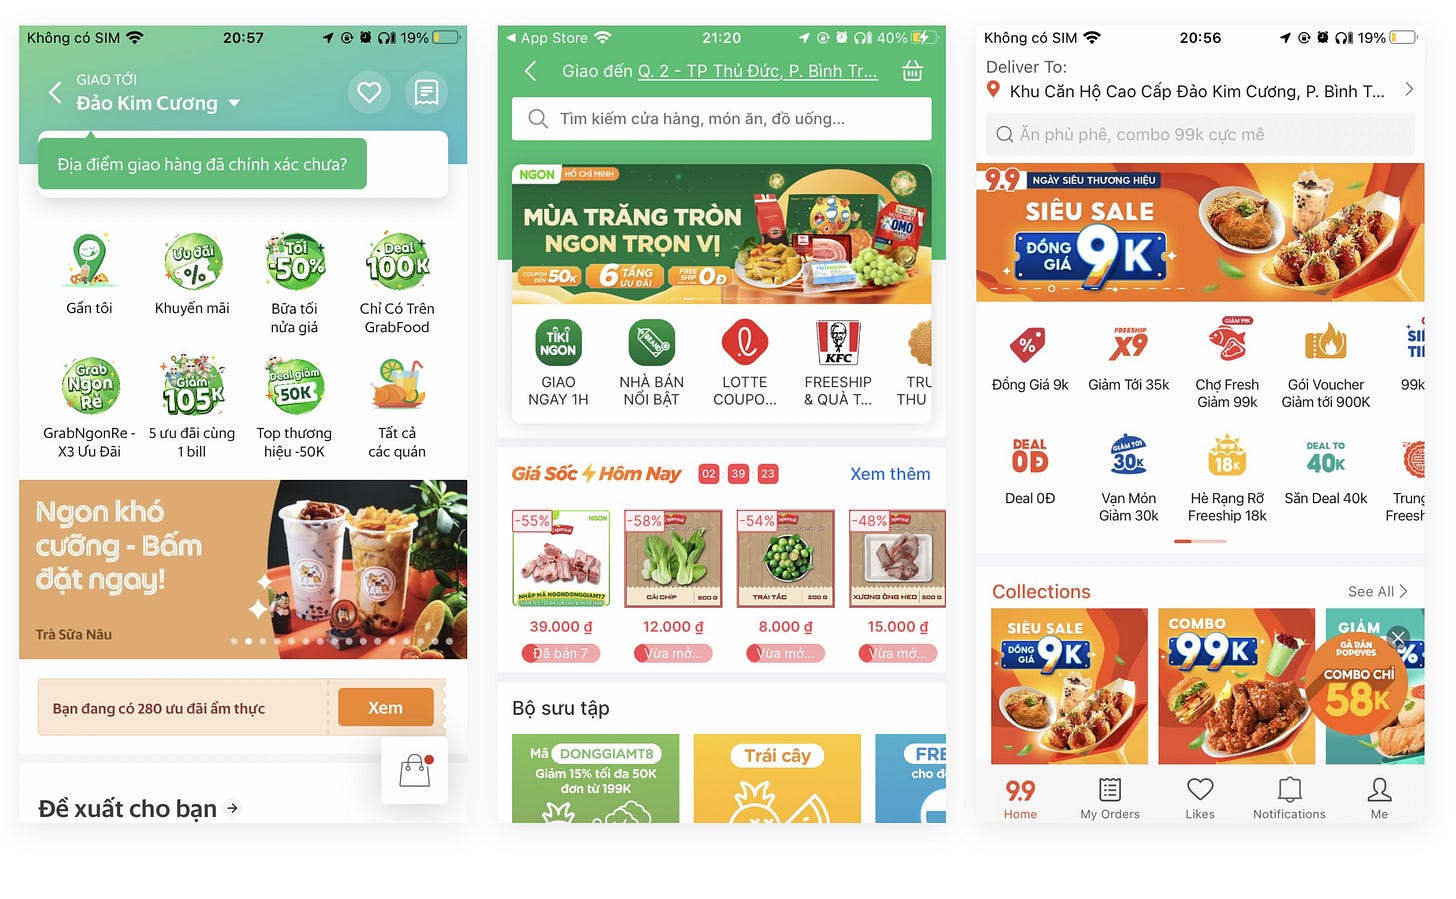
How about the current exploration experience of the apps operating in the Vietnam Market?
We can see that most of the apps operating in the Vietnam market have a design full of promotional collections and discounted prices displayed to attract users, highlighting a very promotional-driven design.
So, for BAEMIN, what do we want to achieve?
In alignment with business, we want to improve the profitability of orders by increasing the AFV (average food value) per order and reducing the CPO (cost per order), also ensuring the experience of users when browsing and finding the food they want
Improving the experience by understanding our users leads to improvement of business metrics – We can be different to deliver better values by diverting from the unsustainable promotional design; by providing a better and tailored experience, we hope users will keep using BAEMIN to order food.
Our approach
Understand different segments
Why? – Not every user cares much about the promotion. They want to find food or discover the right food to order quickly. If we want to provide better service, we need to understand the needs of different segments of users.
Objectives – We want to identify different user needs and categorize them into user groups; we also want to identify the eat-out journey of each segment so that our product design team can better design the app's layout, structure, and flow.
Method – In-depth interviews: we invited users to a 1-hour interview section and asked them about their behavior when ordering food online.
Criteria
The criteria is based on the most active users in the last 3 months.
Age group: 23-30
Gender: Male/ Female
Location: 2 big cities (HCMC and Ha Noi)
Income: age range 23-25: from ~US$900; age range 26-30: US$1,200 (we tried to get as much away from the promotional driven or less loyal users as possible)
Occupation: office workers, freelancers, self-employed,...
Here are the results we got from in-depth interviews
There are 6 segments of users:
The Foodie and Bargain Hunter: most promo-driven, their final decision depends on the discount amount on the order.
Quality Seeker and Health Enthusiast: The most important factor is to find the right food for their needs.
Convenience Seeker & The Safe Player: care about placing the order ASAP from familiar restaurants to ensure the quality of the meal.
Quantifying the insights
After the qualitative insights, we need to quantify them with the current pool of users of BAEMIN to see the percentage of each segment and the distribution of these segments.
Objectives – By understanding both attitudinal insights (what users say) and behavioral data (what users actually do), we would be able to design the right and tailored experience for each user segment.
Method – Combining 2 methods: Survey (attitudinal) and Data logs (behavioral). We sent out a survey asking questions based on the insights found from the qualitative interview and then compared the answers from the survey with the real data from our tracking.
Criteria
Current BAEMIN users
Sample size: 700-1000 responses
Age group: 23-30
Gender: Male/ Female
Location: 2 big cities (HCMC and Ha Noi)
Income: from ~US$900
First, the results from the survey show the distribution of these 6 segments as below.
Bargain Hunter is obviously the most popular user segment, followed by The Foodie, which accounts for 28% and 19% of BAEMIN users. Convenience seekers, quality seekers, health enthusiasts, and safe players have lower contributions.
Now, we Map the results with behavioral user data.
We connected the user ID from the survey with the real data gathered from users’ activities, then selected some of the most important measurements, such as:
Average Spending
We asked users about their average willingness to spend for ordering food online from the survey and compared it with their actual spending from ordering (median) on BAEMIN.
We can clearly see a gap between actual spending on BAEMIN and the user's willingness to spend on food delivery. This gap is significantly bigger for the Quality Seeker, Health Enthusiast, and Convenience Seeker segments. The 3 other segments have a smaller gap.
We assumed that the quality seeker is the segment of users willing to spend more on BAEMIN, but we haven’t provided them what they need.
Order Frequency
Order Frequency is the number of times that users order food online weekly. Quality Seekers and health enthusiasts spend the most and have the highest order frequency among all segments.
The Correlation between exploration time and decision making
The Foodie and Quality Seeker are two segments that often decide what to eat after opening the app, so they often spend much time browsing food/ resto, which makes them easily influenced by attractive photos/advertising/promos.
Design Solution
With the insights and understanding gained from the research and analysis above, I came up with a design solution that aligns with the main Goals and Metrics set below:
Primary Goal
Increase the number of orders with fewer promotions – We want to increase profit by increasing the number of orders with fewer promotions applied.
Primary Metrics
Maintain or increase healthy average order frequencies: 4 orders per user a week.
CPO: reduce to below xx.xxx VND → which means reduced promotion applied to each order; we assumed that if users could find the right food, they would likely order without much promotion applied.
Maintain or improve the Conversion rate
Secondary Goal
Ensure each segment finds foods based on their needs – We want to maintain a healthy number of users who visit BAEMIN and keep ordering the food based on their needs.
Secondary Metrics
Increase the number of daily visits of different segments
Increase the accumulation of the order value that is above 100k
Reduce time to convert for each segment
Using Hypothesis Driven Design to ideate for the solutions
From the goals, I made three hypotheses:
These Problems hypotheses can be written as:
For Problem Hypothesis 1 – How might we help Bargain Hunter find their promotional merchants more effectively?
Instead of rows of promo collections, we can simply group them into a card of promotional collections; users who only care about promotion will easily explore those.
For Problem Hypothesis 2 – How might we help suggest a more curated food choice to Quality seekers, Foodies, and Health enthusiasts?
BAEMIN's growth team could create curated lists of restaurants based on different needs: time of day or special occasions. The content could be based on current trends and could be tested with different approaches to figure out the most suitable curated lists for these segments.
For Problem Hypothesis 3 – How might we help Convenience Seeker and Safe Player order food faster and more efficiently?
Provide a filter so users will easily find the restaurants exactly for their needs
Curate a list of top-rated or high-quality restaurants for quality seekers to find the right restaurants quickly.
A new entrance for the home screen
To provide a better way to navigate and focus on user needs, we need to separate different businesses into different sections with a more tailored and suitable design that we call sub-home.
The purpose is to prioritize business by card size and order position. We can turn some cards on and off when needed.
We also tried to move away from a food focus only to a more lifestyle home screen design:
Try the prototype here:
What we’ve learned
Look at some of the top funnels.
At the time of the release, the CR did not change significantly, although the traffic has dropped due to the cut of spending on promotions and coupons.
Also, Merchant visits dropped a little bit.
The CR from merchant screens to add to the basket has been going down since then.
Our assumptions on why these happened are by moving the icon categories from home to sub-home, the exploration journey has been affected by those who heavily used icon categories. We could bring those icons home and test whether the top funnel conversion rates would increase.
However, Delivery Hero, the parent company of BAEMIN Vietnam, has decided to withdraw from the Vietnam market; BAEMIN Vietnam has shut down since then. I will also write another post about why and what has been wrong with BAEMIN in Vietnam, where they used to be the top 3 in food delivery.


Hi anh, một bài viết rất chi tiết và đã giúp em học được rất nhiều thứ ạ. Em có một vài thắc mắc (em xin phép được viết bằng Tiếng Việt ạ). Nếu em có quan điểm chưa đúng thì mong anh có thể tốn chút thời gian giúp em hiểu hơn ạ. Em cảm ơn ạ.
Dựa vào data có thể thấy số lượng nhiều users sử dụng search bar (hoặc icon categories} để tìm món ăn, nhưng phần giải pháp thì em thấy đang tập trung vào redesign lại màn Home mà không đề cập đến journey thông qua search bar mà những user segmentations này sẽ tương tác. Dựa vào đó em có 2 câu hỏi, mong anh có thể giải đáp ạ:
1. Vậy khi journey của users bắt đầu từ search bar, thì lúc đó giải pháp hiện tại sẽ được xử lý như thế nào?
2. Em có một giả định như này: “Giả sử data chỉ ra rằng % scroll ( hoặc % clicks) của users trên màn Home là tương đối cao, lúc đó mình dựa vào keywords search của users để suggest ra kết quả match với needs của họ”. Liệu đây có phải lý do mà team chọn màn Home để revamp không ạ?
So even though bargain hunters are your largest user segment, you still decide to reduce the number of promotions and believe that quality seekers will not switch to one of your competitors with a better promotion. The decision-making here seems weird to me.